[fusion_builder_container hundred_percent=”no” equal_height_columns=”no” menu_anchor=”” hide_on_mobile=”small-visibility,medium-visibility,large-visibility” class=”” id=”” background_color=”” background_image=”” background_position=”center center” background_repeat=”no-repeat” fade=”no” background_parallax=”none” parallax_speed=”0.3″ video_mp4=”” video_webm=”” video_ogv=”” video_url=”” video_aspect_ratio=”16:9″ video_loop=”yes” video_mute=”yes” overlay_color=”” video_preview_image=”” border_size=”” border_color=”” border_style=”solid” padding_top=”” padding_bottom=”” padding_left=”” padding_right=””][fusion_builder_row][fusion_builder_column type=”1_1″ layout=”1_1″ background_position=”left top” background_color=”” border_size=”” border_color=”” border_style=”solid” border_position=”all” spacing=”yes” background_image=”” background_repeat=”no-repeat” padding=”” margin_top=”0px” margin_bottom=”0px” class=”” id=”” animation_type=”” animation_speed=”0.3″ animation_direction=”left” hide_on_mobile=”small-visibility,medium-visibility,large-visibility” center_content=”no” last=”no” min_height=”” hover_type=”none” link=””][fusion_text]
A couple of the big questions I get all the time are:
- What’s more important – the daily chart or the 60-minute chart?
- What’s the difference between getting into a trade for cash flow vs. a breakout
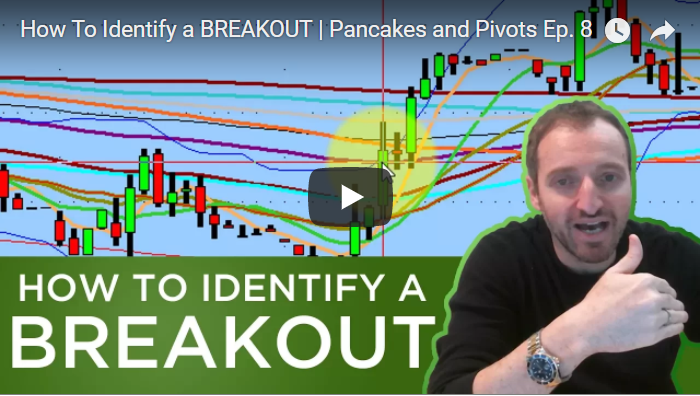
In the latest episode of Pancakes and Pivots, I use $TSLA to illustrate the difference between cash flow and breakouts and to show you how to identify stocks that have breakout potential.
One big thing to clear up about breakouts is that the term itself is widely misused by traders. A lot of times traders are calling a move a breakout when, in reality, it’s just a regular move. In fact, the vast majority of stocks – I’m talking 98% – aren’t breaking out.
As a result, we are just trading for cash flow most of the time. We’re looking for $1 moves here, $2 moves there, whatever it may be. That’s actually a big reason I prefer to trade beta stocks. The big names don’t need to have a “breakout” to be tradeable. You can still get plenty of cash flow opportunities throughout the week without ever seeing a true “breakout.”
So what is a breakout then? Simply put, a breakout is a very specific event in which a stock goes from untradable to tradeable. The longer a distribution channel extends, the bigger the potential move can be once the stock confirms that channel. If you believe in the theory that stocks trade from supply to supply, then you’re expecting that the next measured move will stop at the next supply zone.
Tesla (#beststockevaaaaa) provided a great example of trading for cash flow and how to recognize a potential big move – in this case, from $311 to $320. In the video below, I explain the thought process of trading $TSLA in anticipation of such a move. I discuss the importance of recognizing that liquidity comes at whole numbers, as well as the reasons why daily charts are always the most important and 60-minute charts come in second. This is one of the most valuable videos I’ve put out and you’ll get a lot more from the content by watching the example. The example starts at [11:38] and I really get into the meat of it at [20:15].
Happy trading.
[/fusion_text][/fusion_builder_column][/fusion_builder_row][/fusion_builder_container][fusion_builder_container admin_label=”” hundred_percent=”no” equal_height_columns=”no” menu_anchor=”” hide_on_mobile=”small-visibility,medium-visibility,large-visibility” class=”” id=”” background_color=”#074b6b” background_image=”” background_position=”center center” background_repeat=”no-repeat” fade=”no” background_parallax=”none” enable_mobile=”no” parallax_speed=”0.3″ video_mp4=”” video_webm=”” video_ogv=”” video_url=”” video_aspect_ratio=”16:9″ video_loop=”yes” video_mute=”yes” video_preview_image=”” border_size=”” border_color=”” border_style=”solid” margin_top=”” margin_bottom=”” padding_top=”10px” padding_right=”” padding_bottom=”10px” padding_left=””][fusion_builder_row][fusion_builder_column type=”1_1″ layout=”2_3″ spacing=”” center_content=”no” hover_type=”none” link=”” min_height=”” hide_on_mobile=”small-visibility,medium-visibility,large-visibility” class=”” id=”” background_color=”rgba(255,255,255,0)” background_image=”” background_position=”left top” undefined=”” background_repeat=”no-repeat” border_size=”0″ border_color=”” border_style=”solid” border_position=”all” padding=”20px 60px 20px 60px” margin_top=”” margin_bottom=”” animation_type=”” animation_direction=”left” animation_speed=”0.3″ animation_offset=”” last=”no”][fusion_text]
Ready to level up your trading and improve your win rates?
[/fusion_text][fusion_button link=”https://aatrader.co/post-btm-cta” title=”” target=”_self” link_attributes=”” alignment=”center” modal=”” hide_on_mobile=”small-visibility,medium-visibility,large-visibility” class=”” id=”” color=”default” button_gradient_top_color=”” button_gradient_bottom_color=”” button_gradient_top_color_hover=”” button_gradient_bottom_color_hover=”” accent_color=”” accent_hover_color=”” type=”” bevel_color=”” border_width=”” size=”large” stretch=”default” shape=”” icon=”” icon_position=”left” icon_divider=”no” animation_type=”” animation_direction=”left” animation_speed=”0.3″ animation_offset=””]call to action[/fusion_button][/fusion_builder_column][/fusion_builder_row][/fusion_builder_container]